
All media presented below is licensed under a Creative Commons Attribution-ShareAlike 4.0 International License.
All images and movies were created with the Meraxes semi-analytic galaxy formation model, run on the Tiamat N-body simulation.
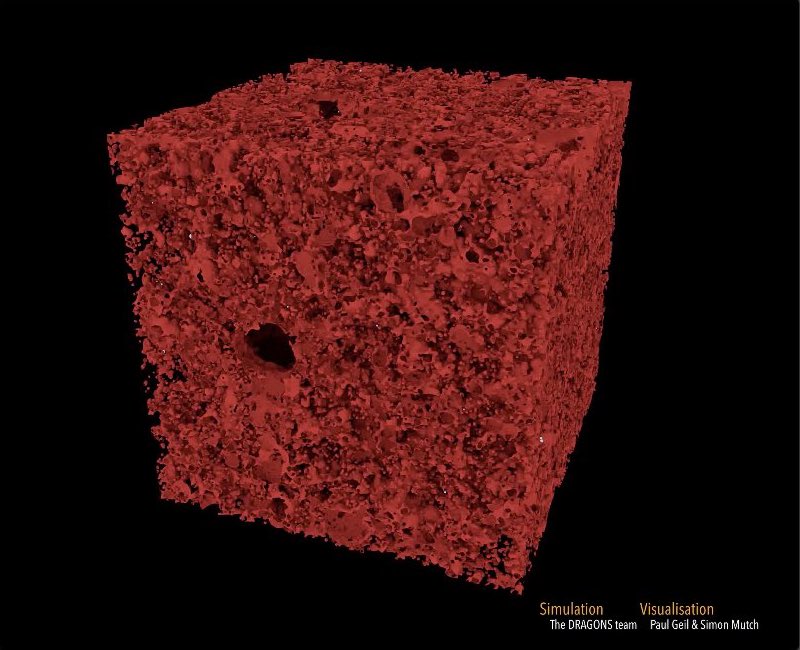
Evolving reionisation cube
This animation shows the evolution of a simulated patch of the Universe, approximately 325 million light years across. The red shading shows the surface of "bubbles" of ionised hydrogen surrounding the first galaxies. The biggest and brightest of these galaxies are themselves shown as white spheres. (18.3MB)
Credit: Paul Geil & Simon Mutch
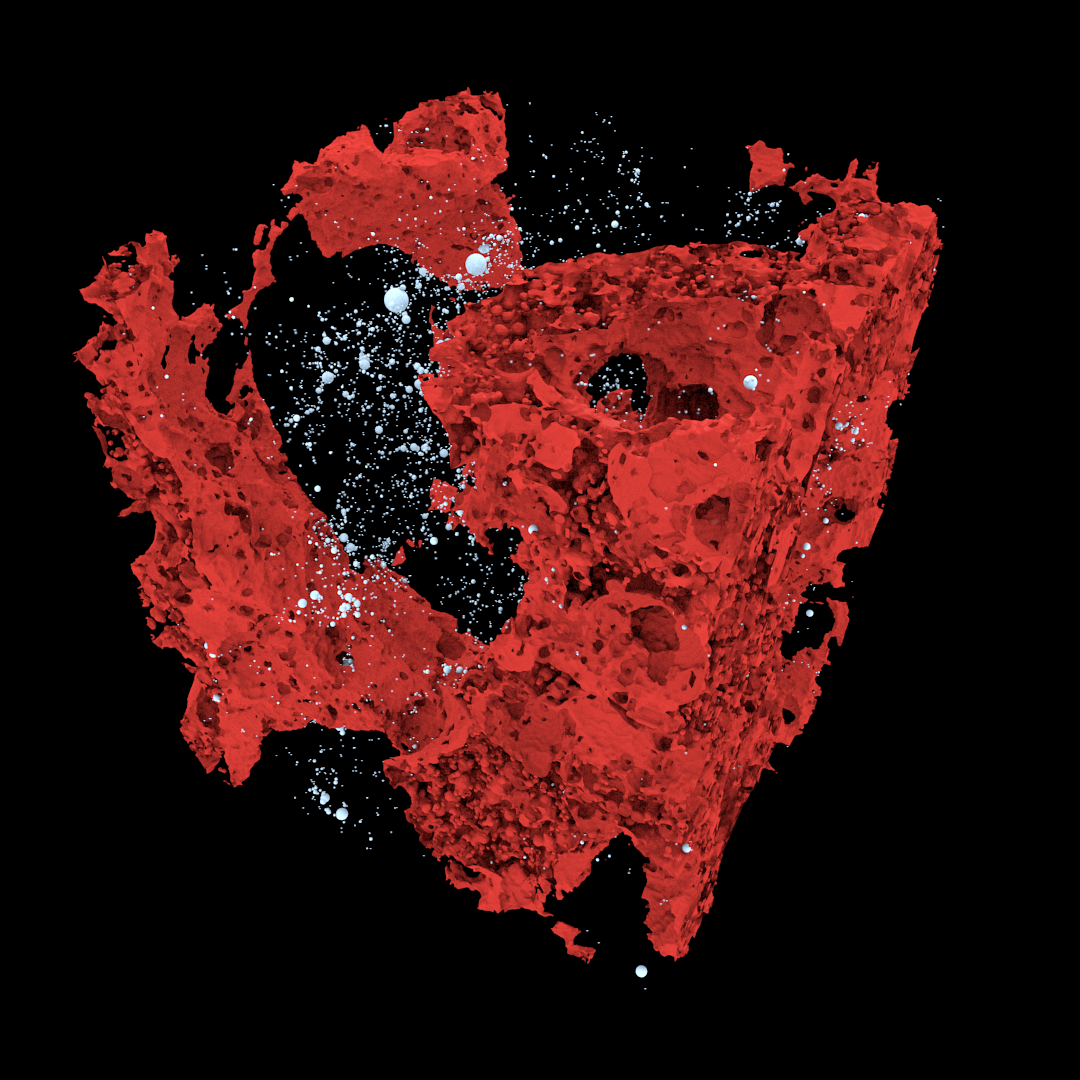
Still of reionisation cube
A high-res still from the reionisation cube animation. (1MB)
Credit: Paul Geil & Simon Mutch
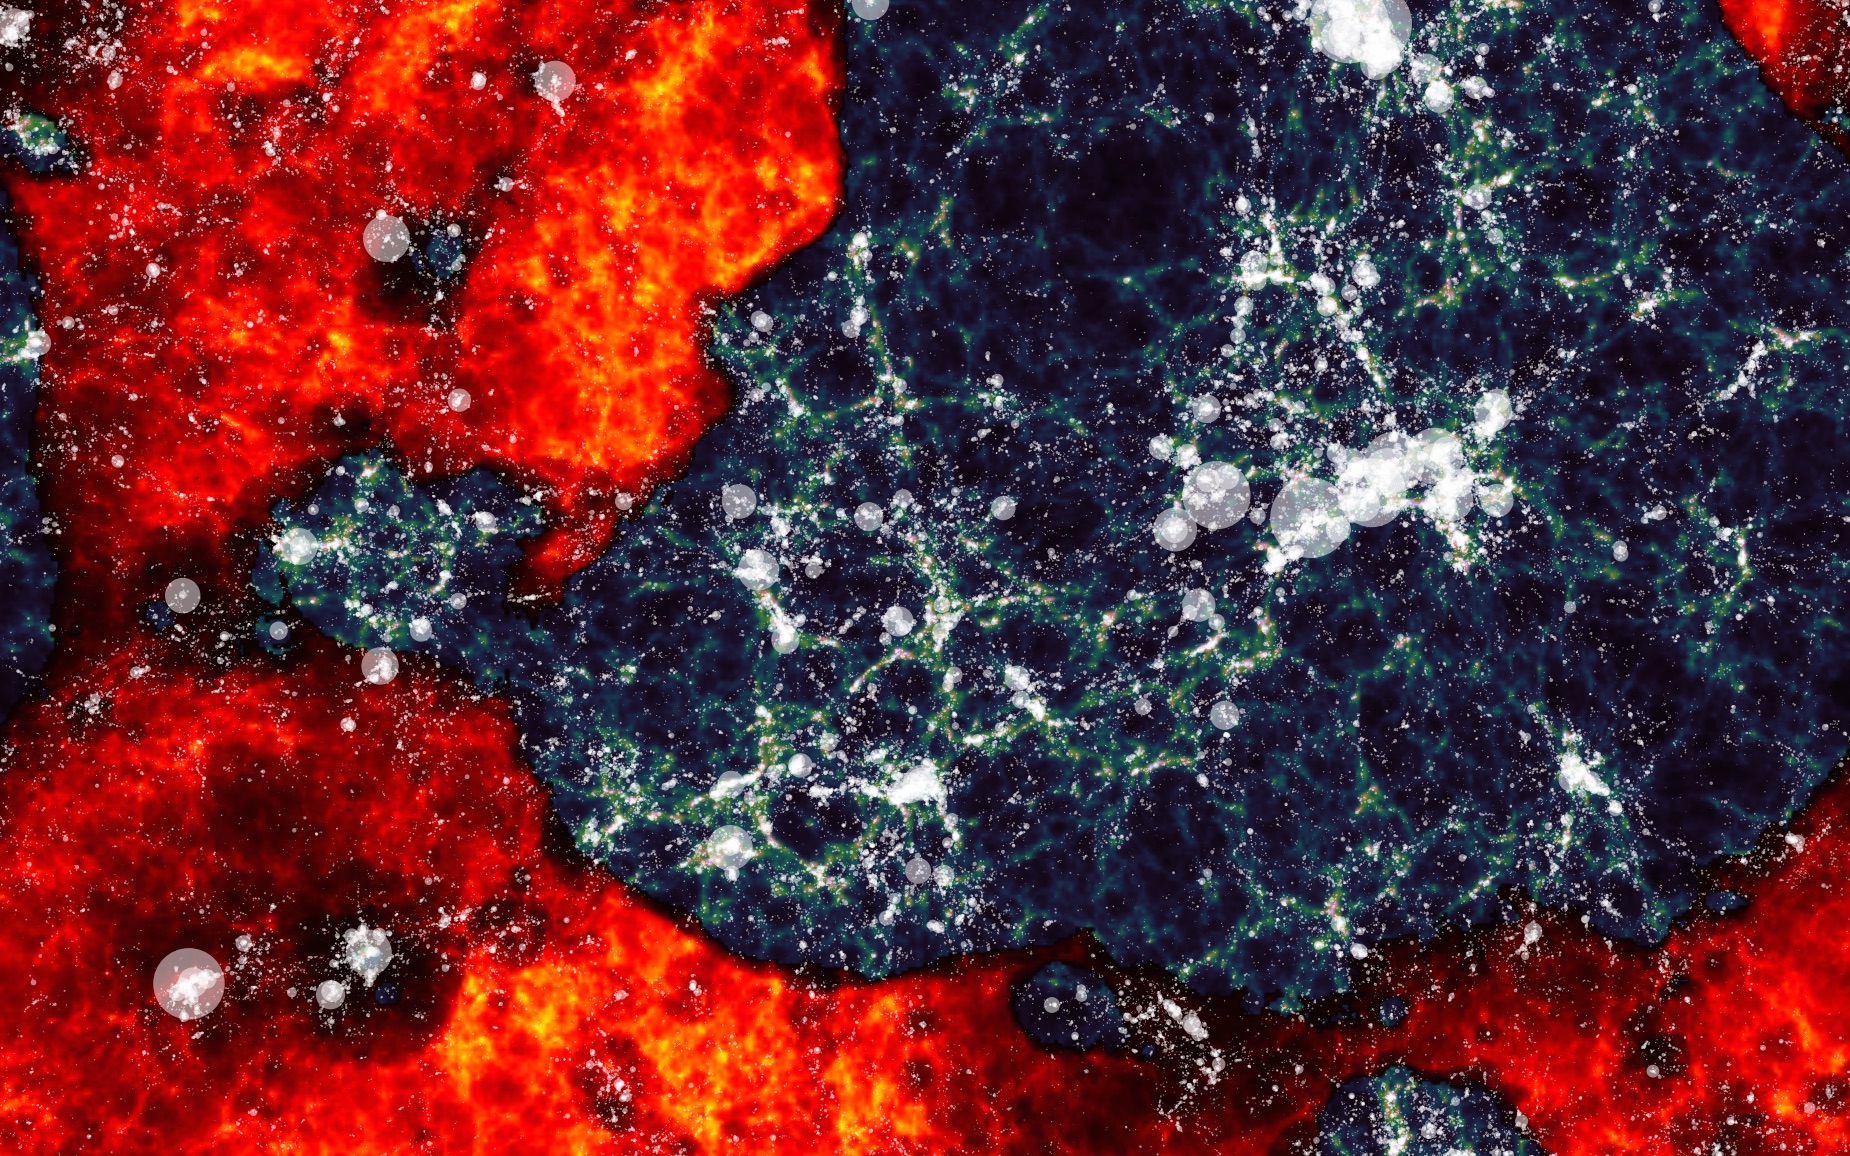
Composite reionisation image
This image shows a thin slice of the full simulation during reionisation (~ 326x326 million light years squared). Red regions show the neutral hydrogen gas of the intergalactic medium. The green filamentary structure shows the underlying distribution of mass, forming the "cosmic web". White circles show the positions of the brightest galaxies in the slice, scaled by their stellar mass. (1.1MB; higher resolution version available upon request)
Credit: Paul Geil & Simon Mutch
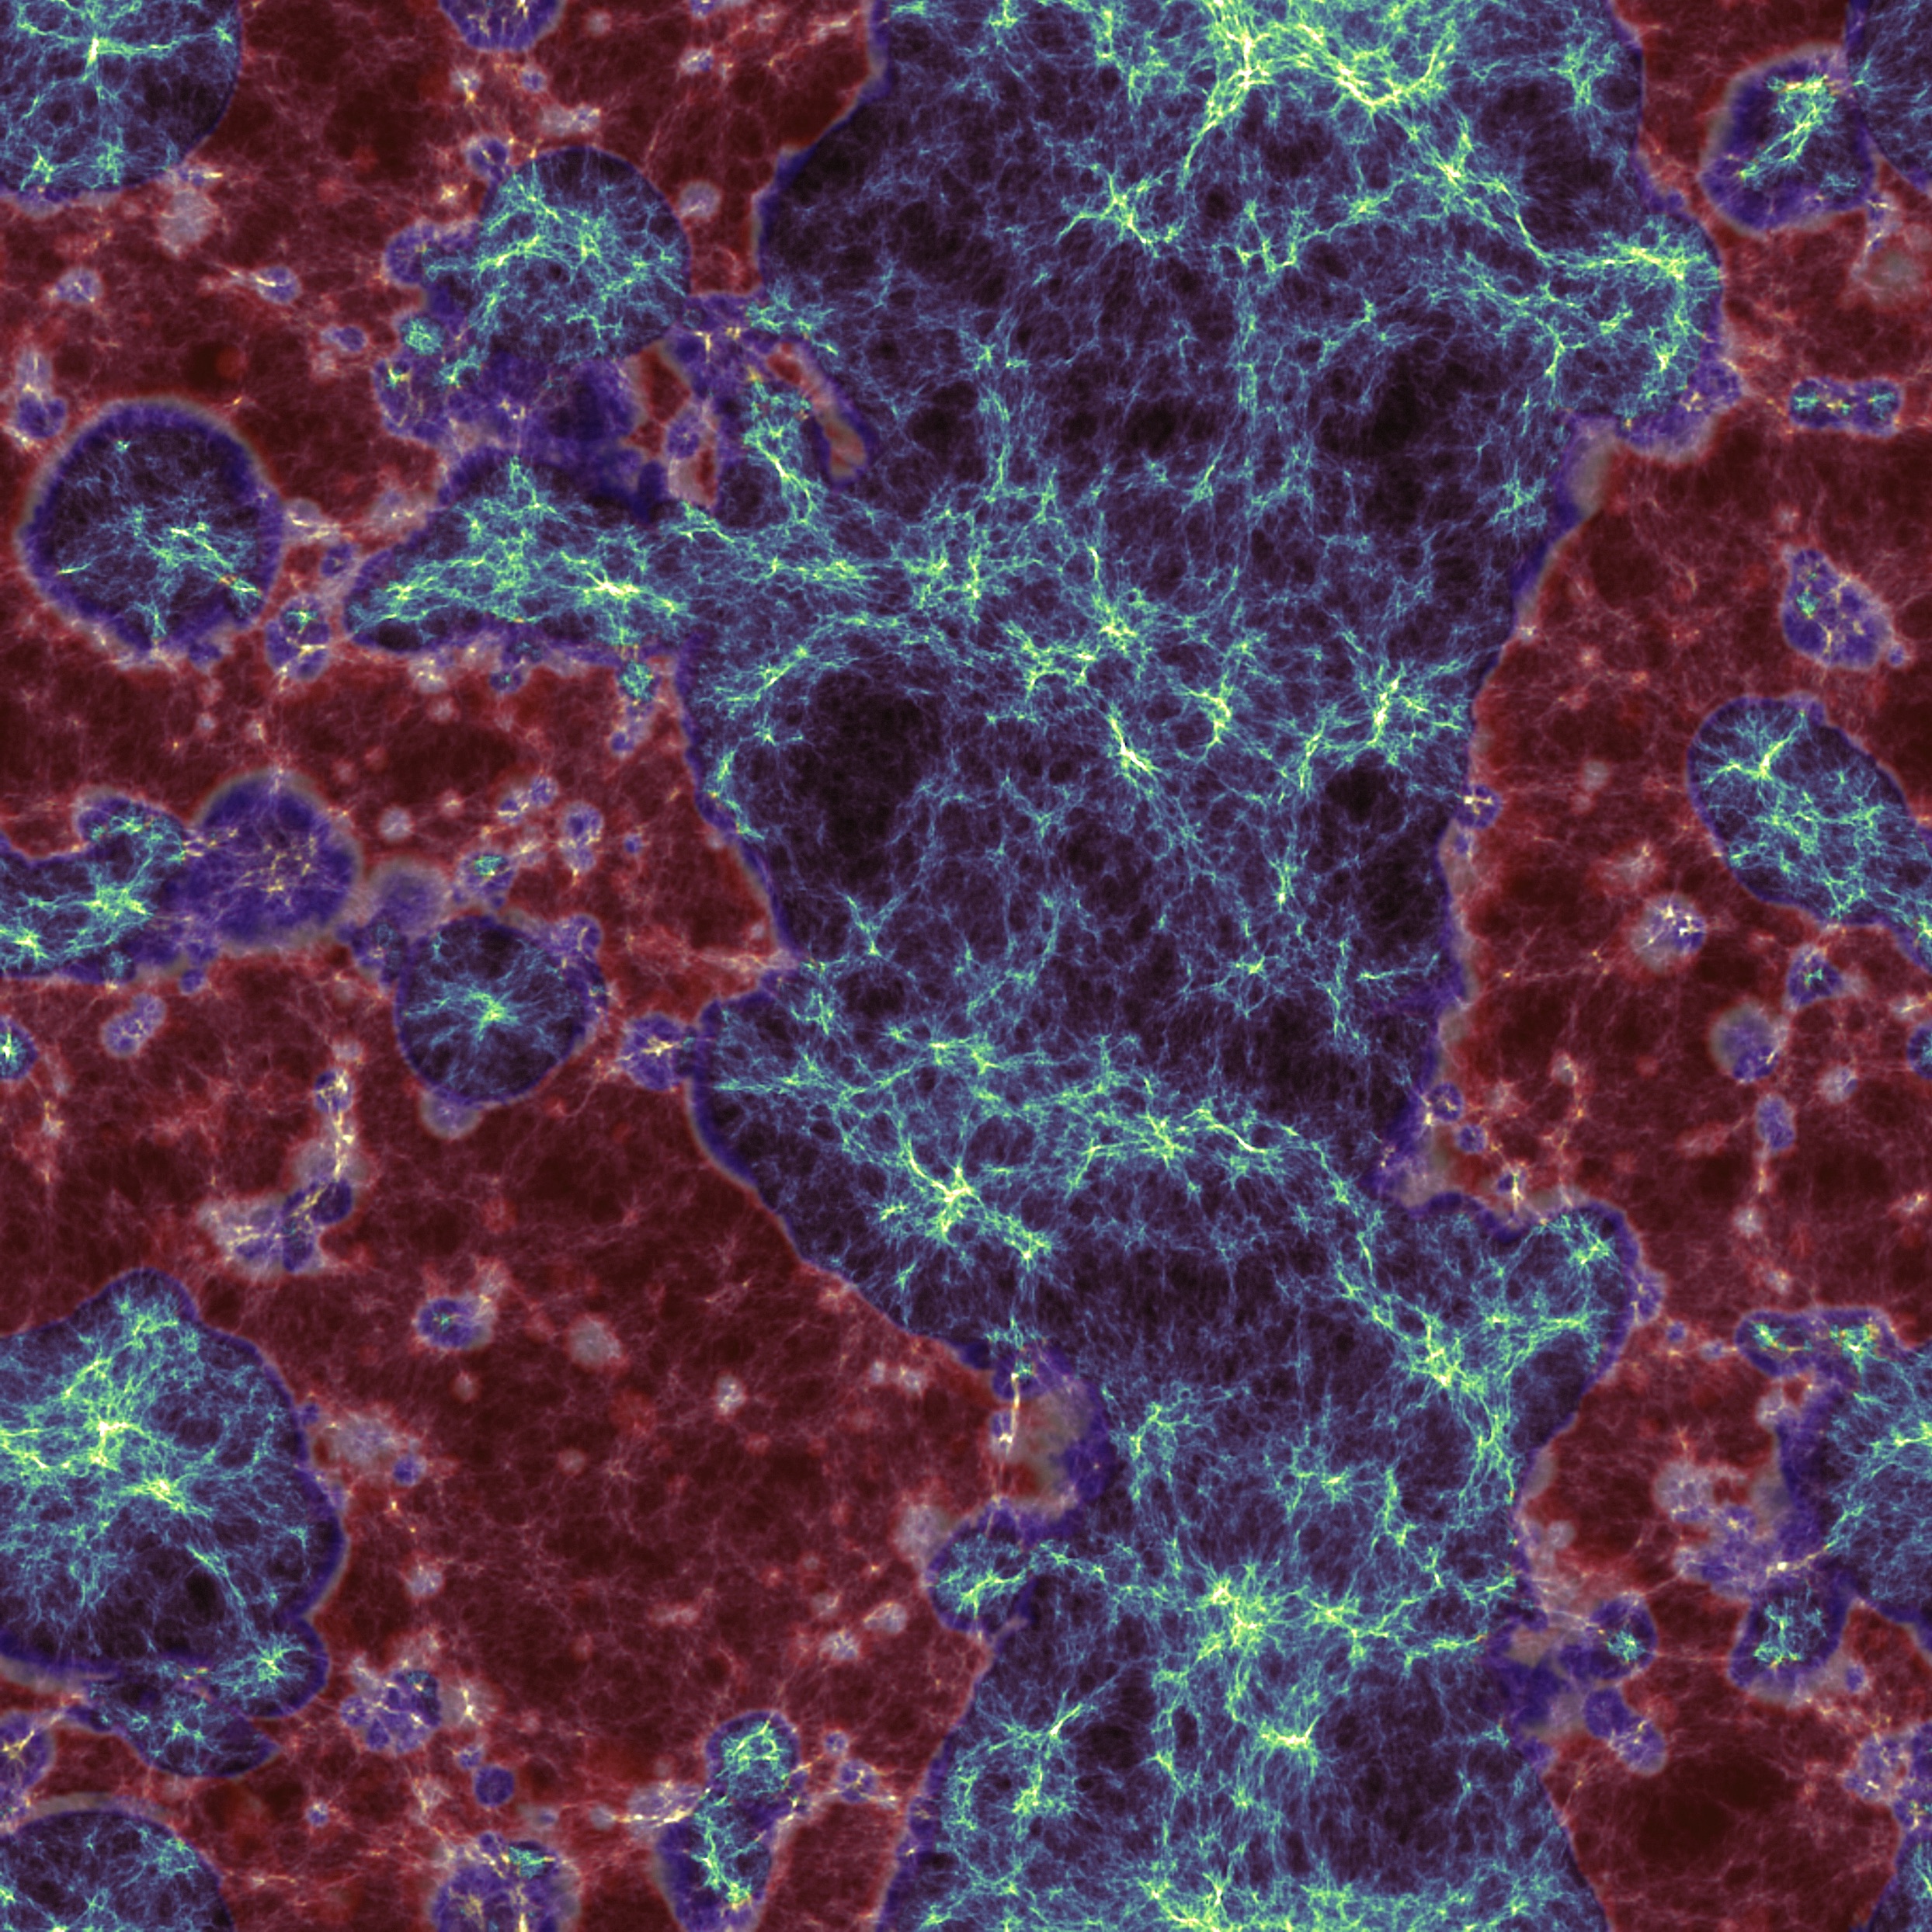
Large scale structure
This image shows another thin slice through the full simulation volume (~ 325x325 million light years squared). The large scale distribution of matter is shown in green whilst the distribution of neutral hydrogen is shown in red. (1.7MB)
Credit: Paul Geil & Simon Mutch
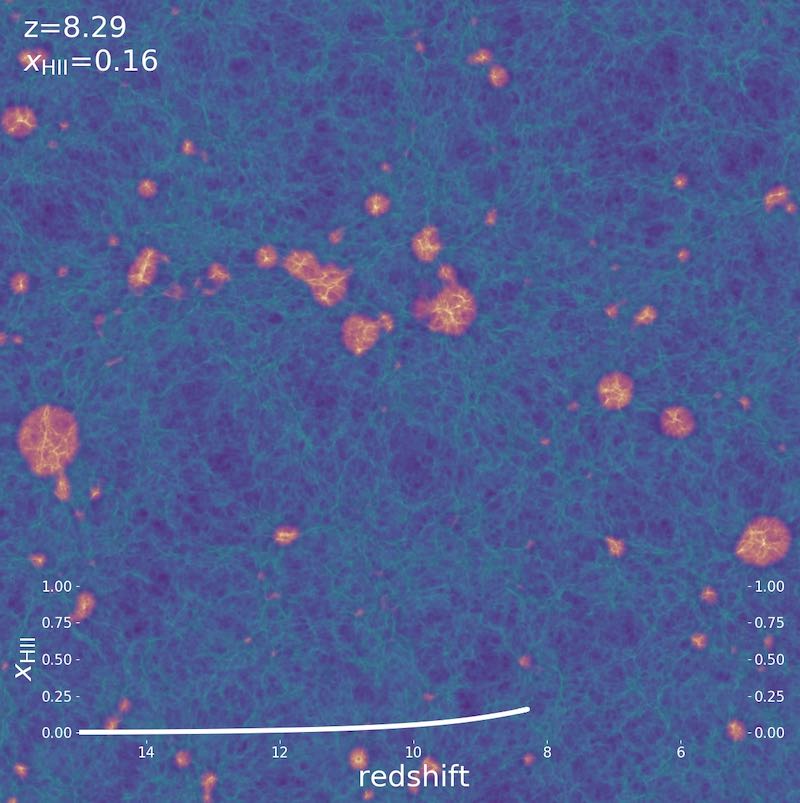
Evolving slice
This movie shows the evolution of a thin slice of the full simulation. Blue-green shows the distribution of neutral hydrogen, whilst orange-red regions show ionised hydrogen. The first galaxies form at the intersection of filaments in the cosmic web. As they grow and evolve, they emit more and more high-energy light, which strips electrons off of the neutral hydrogen and causes the ionised bubbles to grow in size. More galaxies also continue to form. Eventually the bubbles all overlap and the universe becomes fully reionised. The plot at the bottom shows the evolution of the volume-averaged global neutral fraction (xʜɪ) as a function of redshift (z). (7MB)
Credit: Paul Geil & Simon Mutch